

How to Use Google Trends for Dropshipping Correctly
Use six Google Trends checks to compare relative interest fairly, classify a product signal, and validate it with sales and cost evidence.
In 2026, use these 6 secret tips for using Google Trends for dropshipping to compare relative search interest within one market and time range. Compare like-for-like terms, inspect queries and regions, then seek sales evidence elsewhere.
My two Shopify stores sold one-time products. Any idea still had to cover shipping, returns, and the cost of finding a buyer.
The Six-Step Trends Check gives you a clear result. It keeps a search chart from becoming a launch decision.
Key takeaways
How do you use Google Trends for dropshipping?
Use Google Trends for dropshipping by fixing the market, time range, category, and search surface before you compare terms. Read the chart as relative search interest, classify the pattern as pass, fail, or uncertain, and confirm any promising result with current marketplace sales and supplier evidence.
Google compares each point with all searches in the chosen place and time. It then uses a 0-to-100 scale. Orders, revenue, margin, and supplier performance need other evidence.
Within your chosen view, 100 marks the point with the highest relative interest. The number is an index rather than a search, order, or product score.
The six carried screens below were reachable on September 9, 2026.
Google Trends Explore rate-limited my automated recheck, so the screens remain interface examples. They aren't current demand evidence.
Rerun each query before you make a product decision.
Summary: Save every chart with its settings, date, and the sales evidence it still needs.
Run the Six-Step Trends Check
Run the Six-Step Trends Check with one recorded input and one consistent set of filters.
Run the steps in this order,
- Choose the input: Decide between an exact search term and a topic.
- Fix the scope: Lock the market, period, category, and search surface.
- Compare terms: Keep every input and setting consistent.
- Read queries: Separate useful buyer language from loose associations.
- Check regions: Find concentration without confusing it with total demand.
- Read time: Separate recurring seasons from isolated spikes.
Each step narrows the query, market, or time window used in the next check.
1. Choose a search term or topic
Choose a search term for exact wording and a topic for the wider concept.
A search term covers the precise characters people type. A topic groups related searches for one concept across languages and spelling variants, according to Google Trends Help.
I start with a topic when I'm exploring a broad category. Exact terms make more sense when the wording points to a product, model, or use.
Record the input type because its coverage changes the line.
Write the input exactly as it appears in Google's menu. Save the topic label when you select one.
If a niche phrase has no topic, keep it as a term and compare it only with terms.
Phone cases show how a broad product term behaves, but the phrase hides the model, material, and style. Use the screen to judge the query setup.
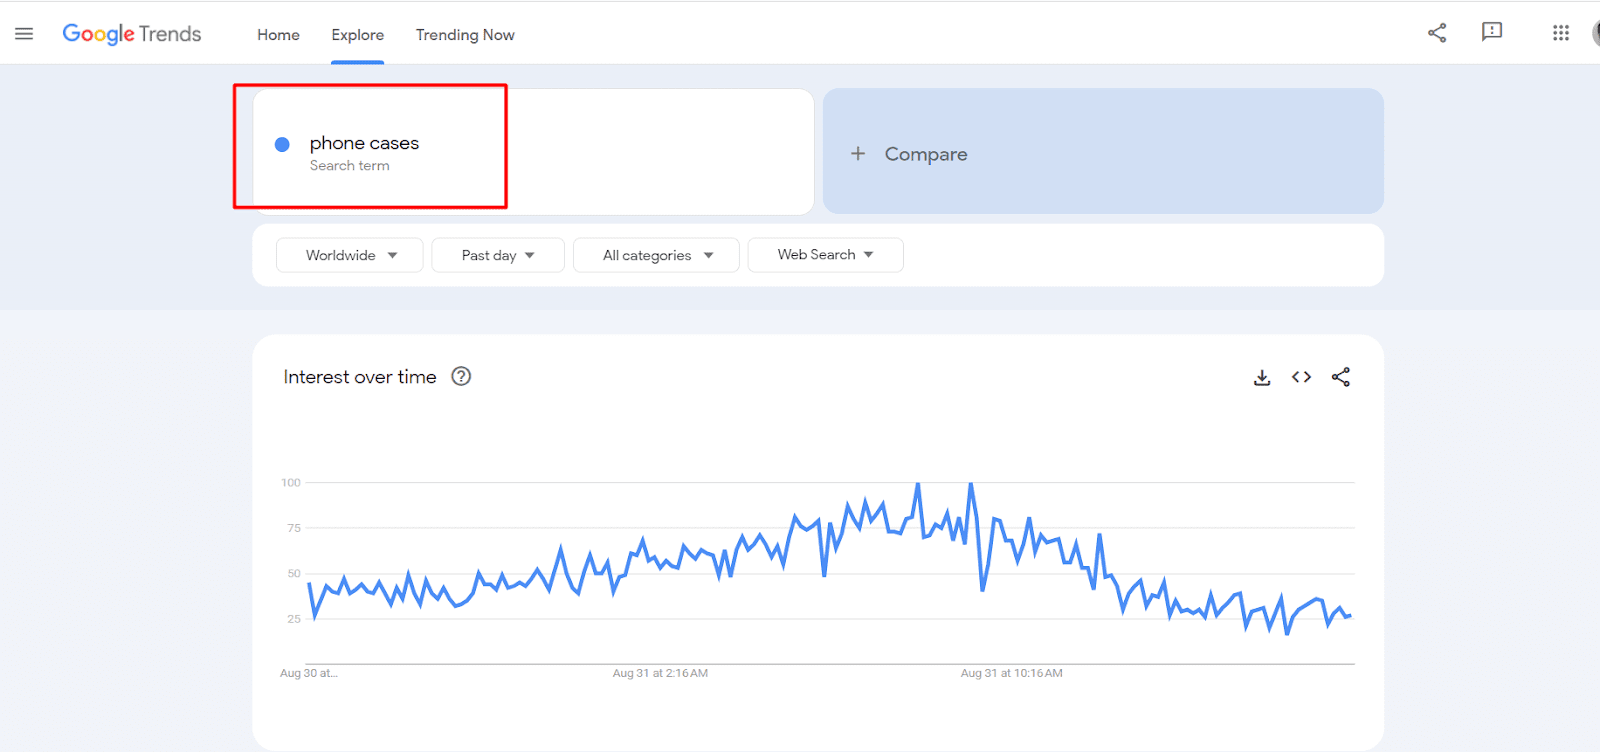
Comparing a topic with an exact term gives each line different coverage. Choose one input type for the full comparison.
2. Fix the market and search scope
Set one country, time range, category, and search surface before reading the chart. These filters define the pool of searches behind every point.
Set each control with a clear reason,
- Use the country where you plan to sell.
- Choose a long view for seasons and a recent view for change.
- Add a category when the term has more than one common meaning.
- Match Web, Shopping, or YouTube Search to the behavior you need.
Keep the same time span for every term. Google's comparison guide makes that rule clear when you compare search terms.
The carried filter screen shows where those settings sit. Save the view and its date. A later pull may use a different pool of searches.
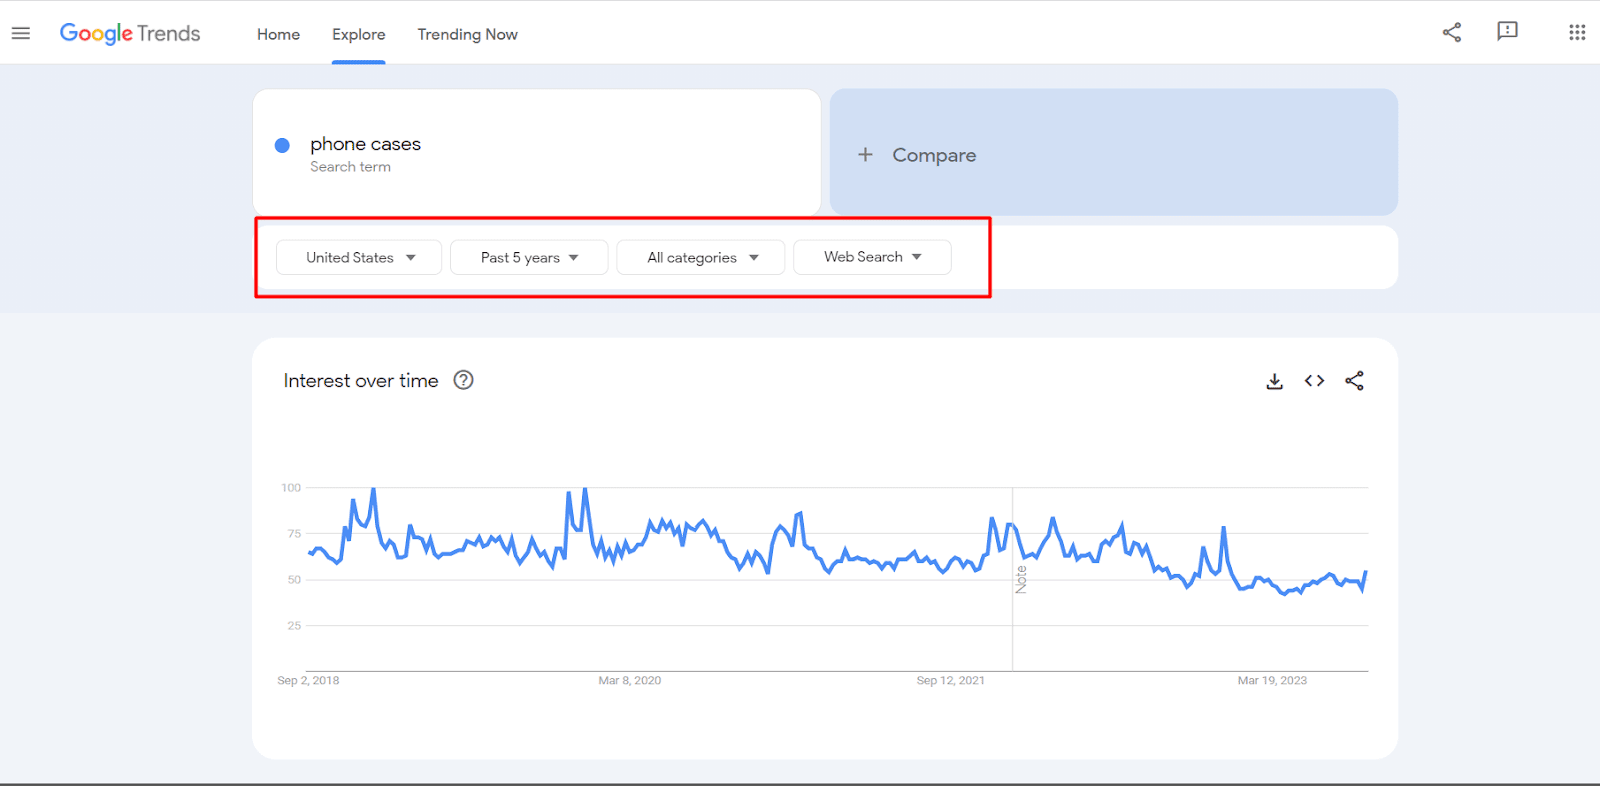
Filters answer different questions. Set a U.S. Google Shopping buying window with a U.S. Google Shopping view.
3. Compare product terms fairly
Compare product ideas only when every term uses the same input type and chart settings. With shared settings, you can see which search pattern is worth checking next.
Keep the comparison repeatable,
- Add every candidate to one chart.
- Save the full query pack with that chart.
- Change one setting when you test another view.
- Record why you changed it.
Google rescales the chart around the terms you include. I compare candidates that serve one decision, such as two product categories for one market.
The phone-cases-versus-yoga-mats screen shows a fair interface setup, but it remains a historical example. Read it for direction and timing under shared settings.
Follow our trend discovery method when you need to test the cause behind a promising line.
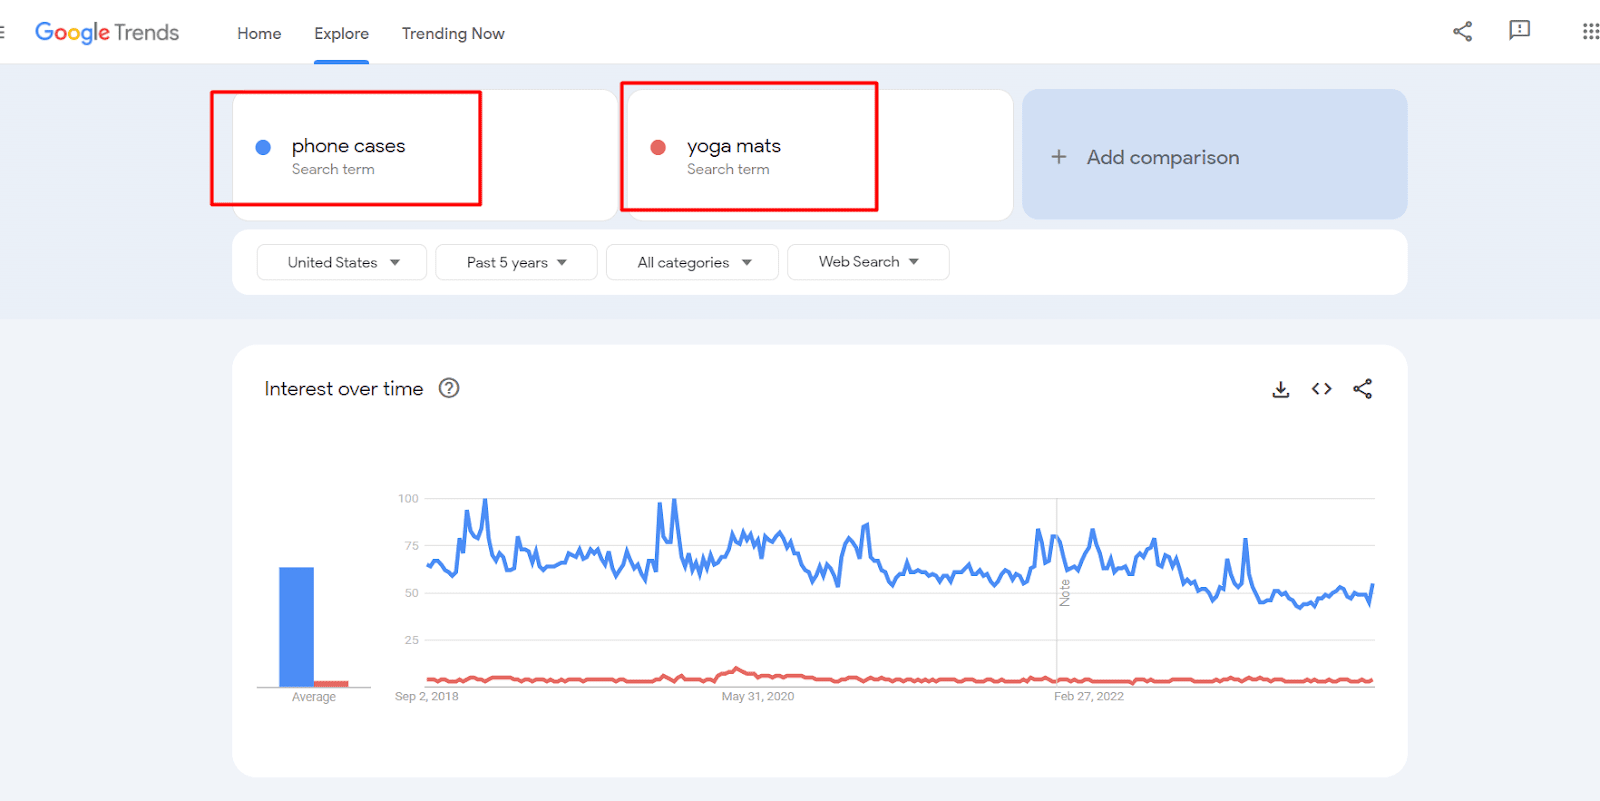
Separate charts can hide that their peaks use different scales. Put the candidates in one view before you rank their patterns.
4. Inspect related and rising queries
Use related queries to find buyer wording, product variants, and new questions around the original input.
Top queries show common associations. Rising queries show the strongest growth during the selected period.
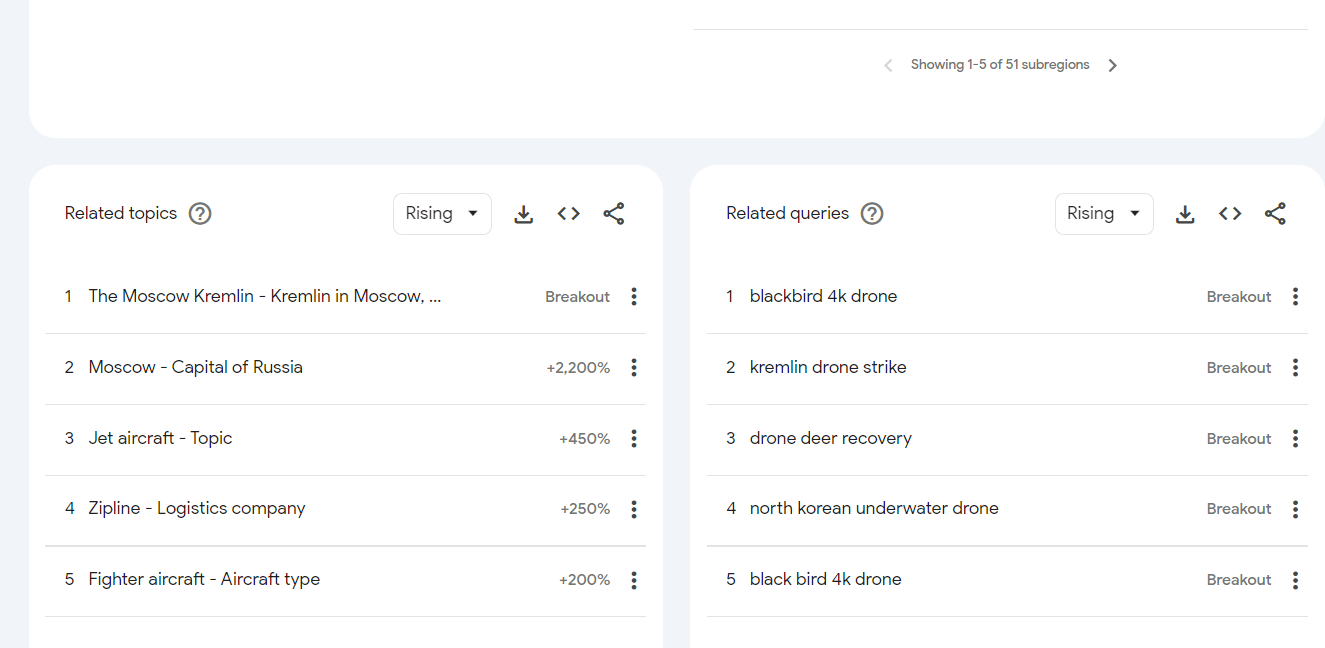
Google labels a rising query as Breakout when growth exceeds 5,000%, according to its related-searches guidance. A small earlier base can produce that label, so read the words before you treat it as useful demand.
Sort the phrases by what the searcher wants,
- Keep product models that make the candidate more specific.
- Keep buying words that point to a product choice.
- Reject phrases about repairs, celebrities, game cheats, counterfeits, or another meaning.
The rejected searches show that the person wants something other than the product. Save each useful phrase, growth label, and buyer need for the next check. This keeps false leads out of the marketplace check.
Continue when the marketplace allows that product, the supplier can ship it, and its return policy is clear.
5. Check regional concentration
Use regional interest to choose markets for deeper research.
Google calculates local popularity against all searches made in that place and time. Its regional-interest guide explains that each value is a share of local searches.
A darker region can have a higher share of interest and fewer total searches.
Use the regional result in this order,
- Record the locations with the highest relative interest.
- Reopen the refined query for each country you can serve.
- Apply local currency, buyer language, and delivery terms to the next sales check.
Build a country-level view because a global map leaves those market details unresolved.
Blackbird camera drone appears because the live article used it to claim country-level demand. The map can guide your country check, but it can't prove sales.
This narrow term may also provide too little data for a firm reading.
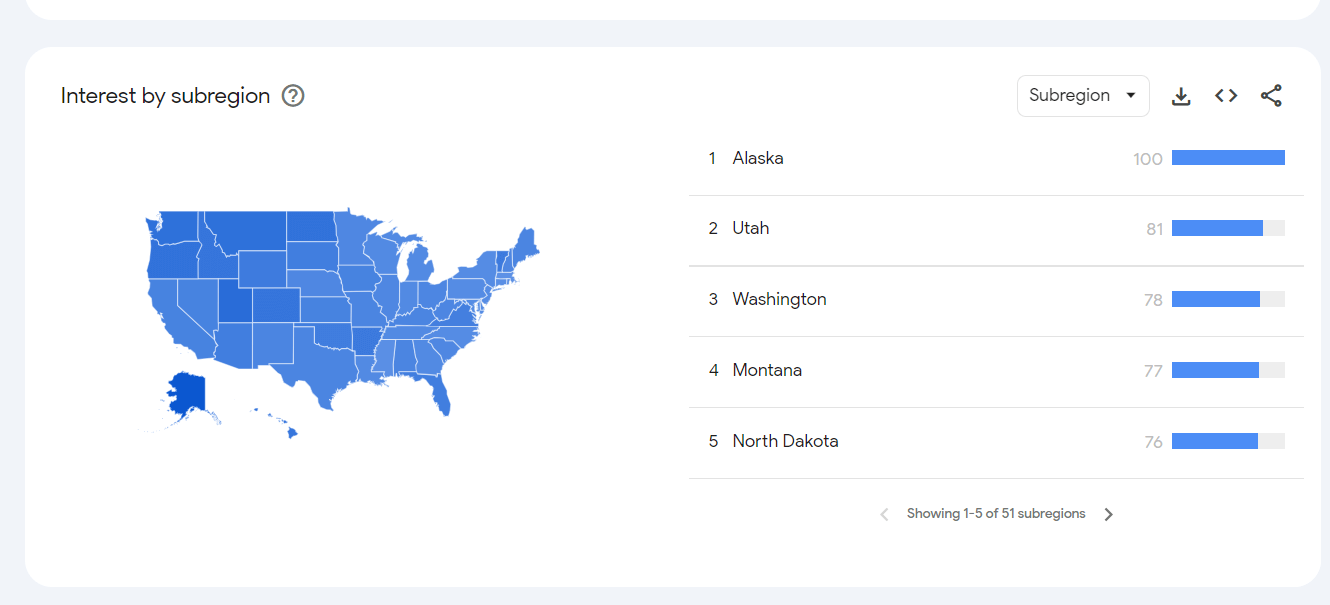
Mark the drone uncertain until a current pull and product-level sales source support the same market.
6. Separate seasonality from a spike
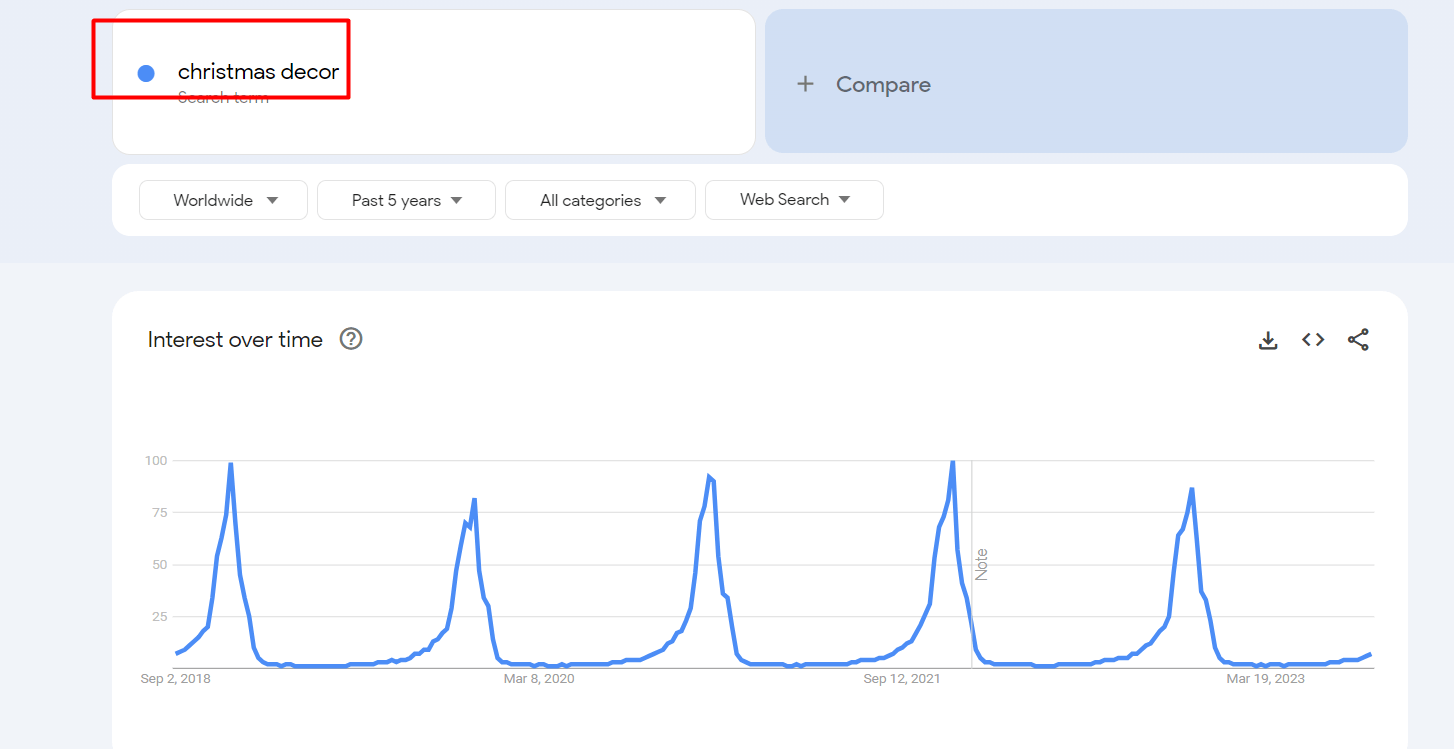
Repeated peaks in the same months show seasonal search interest, while one isolated peak needs an event check. A multi-year view shows recurrence. A shorter view shows whether the current cycle follows the earlier pattern.
Christmas decor makes a seasonal search pattern easy to read. Use it to draft a possible sales window, but confirm that window with monthly marketplace sales. Late samples can miss the period when searches rise.
I use a recurring peak to work backward from the search-interest window. The route must fit before interest usually rises.
Turn that window into a draft calendar,
- Record the month when search interest starts to rise.
- Set the sample deadline before that date.
- Add processing time, shipping time, and a delivery buffer.
- Pause the idea when its route misses the calendar.
One unexplained spike stays uncertain until you match its date to news, a product launch, or another event.
Classify pass, fail, or uncertain
Pass continues to sales validation, fail rejects the tested reading, and uncertain records the missing evidence. Attach the chart and its date to that result.
The three required examples lead to different decisions:
Keep the source date beside each row.
Use the completed record to find winning products without losing the reason behind your decision.
A launch decision needs the commercial evidence that Google Trends leaves open.
Summary: Each classification should name the chart decision and the exact proof still missing.
Validate the signal beyond Google Trends
Validate marketplace sales, competition, landed cost, shipping, returns, and restrictions before you fund a test. These checks answer commercial questions outside the chart.
On September 9, 2026, the public product pages supported these uses,
- Use Product Library for exact products because stale category matches can mislead.
- Use Sales Tracker after matching the product, shop, market, and sales window.
- Use Shop Library for TikTok Shops because other marketplaces need their own data.
Prices and sales fields can change between pulls. Save the page, market, and date before you choose a test budget. Then match the listing to the same product, market, and time window.
A loose category match can mix several offers, so save the exact listing URL and pull date. Another person should be able to repeat the check.
Complete these checks for the exact product and target market,
- Record the listing, sales window, product age, and pull date.
- Count comparable offers with the same buyer and use case.
- Add supplier price, shipping, duties, fees, and refund reserve.
- Get written shipping times and the supplier's return policy.
- Review restrictions from the marketplace, processor, carrier, and destination country.
Use our product research workflow to complete those checks for the candidate.
I recommend a small test if the search pattern and marketplace activity agree. The landed cost must fit your budget, and the supplier must put shipping and returns in writing.
Keep the result uncertain while any one input is missing.
FAQ
Can you compare terms with different volumes?
Yes, when both terms use the same country, period, category, search surface, and input type. Treat the lines as relative interest within that shared view because absolute query totals need another source.
How often should you rerun a comparison?
Rerun it before you fund a test and whenever the market, season, or product wording changes. Save the new pull date so you don't mix results from different contexts.
What if Google Trends shows no data?
Expand the date range, correct the spelling, or remove extra terms from the comparison. Low search volume may leave the graph empty, so mark the result uncertain if those changes still show nothing.


